The purpose of this document is to show the ability of TAS to measure HVAC performance with specific relation to the Trane engineering newsletter entitled ‘Cold Air Makes Good Sense’ Volume 29-2.
The main principle to be reviewed is supplying air to a zone requiring cooling at a lower temperature than traditionally done. Supplying the air at a lower temperature means that less air needs to be supplied. This means that the supply air fan can be turned down. This reduction in supply air volume has many benefits including;
- Smaller air-handling equipment
- Smaller VAV terminals
- Smaller Ductwork
- Shorter floor to floor height (less space needed in between floors)
- Less Fan horsepower
One effect of using colder supply air is the reduction in relative humidity in the cooled zones. This lower relative humidity deters the growth of mould and mildew and means that furnishings and carpets and other building materials are less inclined to developing moisture-related odours.
Comfort can be improved when using cold air supply comes from increasing the room set point by a few degrees. The increased temperature means that lightly dressed people enjoy the warmer temperature, whilst heavier dressed people appreciate the lower relative humidity of the zone, so do not require the zone to be at the cooler temperature.
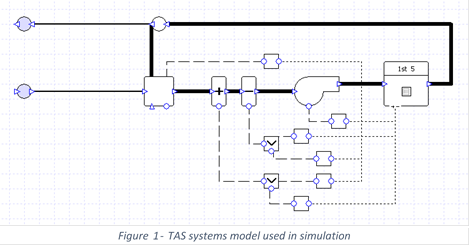
TAS Systems Model
A model was generated in TAS systems to be used in simulations for the traditional and cold supply air. The model made is a simple single zone VAV system with simulations run for both supply air criteria, allowing results to be collected and organised. Below, figure 1 shows this model as seen in TAS Systems.
Conditions Comparison
The cold air model differed from the traditional by lowering the supplied air from 55 Degrees Fahrenheit to 45. As well as this the upper operating condition for the room was increased from 76 to 79. The fan was left to be sized by the design conditions. The conditions and their outcomes are shown below in Tables 1 and 2.
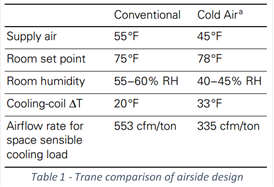
Tas comparison of airside design
|
Conventional |
Cold Air |
| Supply Air (oF) |
55 |
45 |
| Room Set Point (oF) |
72-76 |
72-79 |
| Room Humidity Average Over 1 Year Simulation (%) |
61.5 |
43.7 |
| Cooling-Coil Δ T(oF) |
20 |
33 |
| Airflow Rate for Space Sensible Cooling Load (cfm/ton) |
841 |
517 |
As can be seen in Table 2, the implementation of a cold air strategy results in a reduced airflow rate for space sensible cooling load of 39%. As a percentage reduction this is extremely close to the Trane example which finds a reduced airflow of 39%.
Impacts on System Design
The Trane engineering newsletter outlines how condensation is a major issue that many buildings encounter. It can lead to mould, as well as odour issues that can contribute to indoor air quality problems that can risk the occupant’s health.
Cold air supply reduces the chance of condensation due to the lower relative humidity conditions that the zone will experience. Looking back to table 2, the average relative humidity in the zones during operating hour reduced from 61.5% to 43.7% in the TAS simulation. The lower humidity is attributed to the lower dew-point temperature of the air in the room, meaning that air has to be cooled more than air from a traditional system in order to induce condensate.
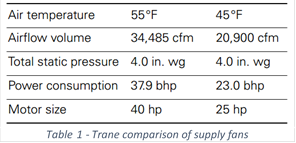
Supply Fan
The reductions in size of the supply fan have been quantified in tables 3 and 4. It can be seen that the reduction in maximum airflow is greater than that of the average airflow. The size of the fan is reduced by 44% in the TAS simulation, whereas in the Trane example it is reduced by 39%. This smaller required fan capacity means that a smaller fan can be used, saving on electricity costs as well as reducing the price of the initial purchase. Savings in power consumption are in line with the savings in airflow rate for space sensible cooling load, with both examples saving 39% again.
Tas comparison of supply fans
| Air Temperature (oF) |
55 |
45 |
| Airflow Volume (cfm) |
9844 |
5555 |
| Total Static Pressure (wg) |
3 |
3 |
| Power Consumption (bhp) |
9.29 |
5.24 |
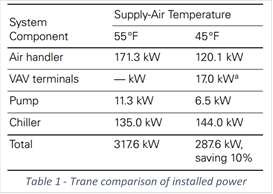
Installed Power
Power usage must be compared in order to quantify what sort of financial savings a cold air supply strategy could be made. Tables 5 and 6 show the Trane and TAS comparisons of power savings. The results show similar savings with Trane expecting a 10% saving whilst TAS simulation also showed a 10% saving.
Tas comparison of installed power
| Supply Air Temperature (oF) |
55 |
45 |
| Fans (kW) |
6.49 |
3.46 |
| Pumps (kW) |
1.72 |
1.74 |
| Cooling (kW) |
42.95 |
40.85 |
| Total Power Consumption (kW) |
51.13 |
46.05 |
| 10% Saving |
The difference in the proportional breakdown of installed power between the Trane and TAS results can be attributed to a few differences. The TAS simulation was done using an Australian climate model whilst Trane used an American location. This may be significant as the American location could have much higher ambient humidity levels relative to Australia. Also, although little is known about what data was used by Trane, it would be reasonable to assume that Australia is likely to be hotter, hence the larger cooling load proportionate to the installed system. The sizes of the systems used also differs, with Trane operating a whole building whilst, for simplicity of results, the TAS simulation only analyses a single room.
TAS also looks at the results over a whole year of use whereas Trane appears to only sample one hour of operation. The TAS results have been averaged over the operating hours in a year to give results that are of a similar magnitude.